
Resources Connection: A Challenged Business, But One Worth Investing In (NASDAQ:RGP)
")
EschCollection
Resources Connection, Inc. (NASDAQ:RGP) is a management consultancy that boasts a “differentiated agile delivery model” and an ability to help firms in challenging situations or in moments of transformation. Nevertheless, the company itself is facing a challenging period, with revenues in decline and with them, its net operating profit after tax (NOPAT). Its returns have suffered, and it does not help that executive compensation is not tied to return on invested capital (ROIC), or something similar, in order to tie shareholder and management interests. That said, the firm is a safe source of dividends and its free cash flows (FCF) are trading at attractive levels. RGP is a lesson that a firm does not need to be great to be worth investing in, because it is trading at a discount to its intrinsic value, and that offers investors an opportunity.
Business Model
RGP provides management consulting services to companies across the world, providing businesses with project execution services to help their clients with their operating needs, and transformation initiatives using what the firm, in its 2023 10-K report calls its “on-demand, experienced and diverse talent”. RGP serves 1,800 clients across 37 countries, including 88% of Fortune 100 companies. It has a 78% retention rate for its top 100 clients in the last five years. It’s not surprising by these numbers that RGP’s latest investor presentation shows that the firm was named as one of Forbes 2024 “America’s Best Management Consulting Firms”, and “America’s Best Midsize Employers”.
Source: April 2024 Investor Presentation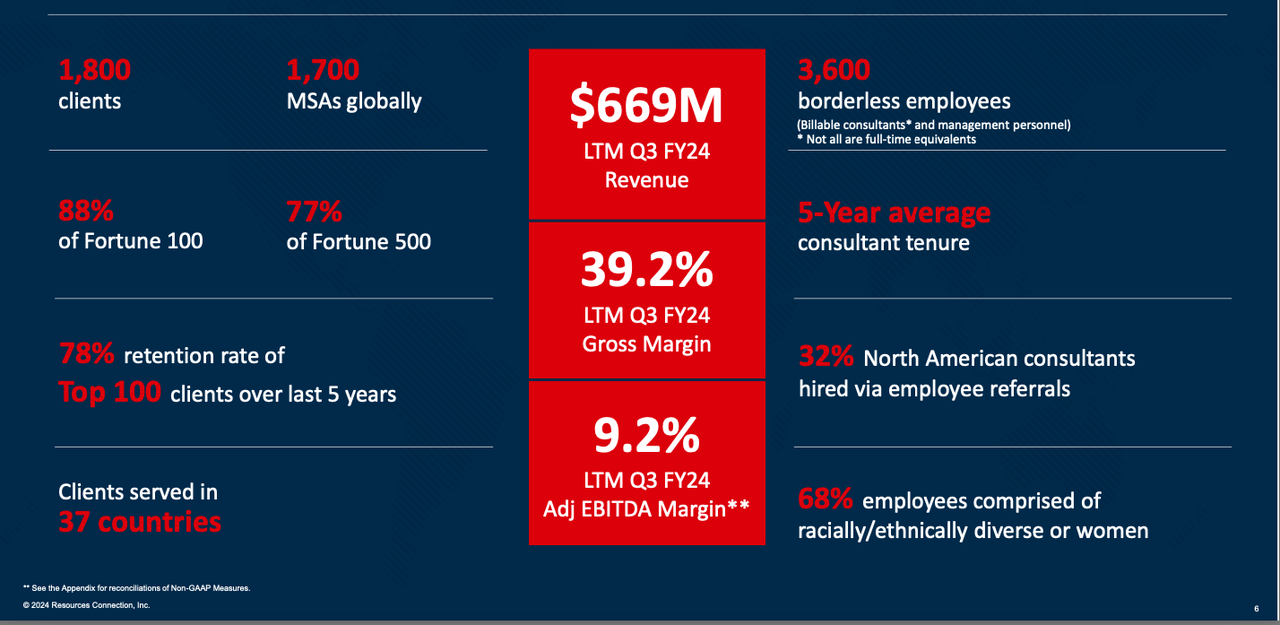
The company attempts to be a flexible and agile human capital partner for businesses undergoing transformation, strategic transactions or regulatory change, calling its model a “differentiated agile delivery model”.
The real question for investors is: is the demand for RGP’s services high enough to deliver a sustainable business model? Intuitively, it makes sense that in periods of disruption, such as the Covid-19 pandemic, for instance, or the arrival of generative AI, demand for RGP’s services would be very high. In “normal” periods, firms may not believe that there is that much to be gained from using a firm like RGP. This could make returns lumpy. I think the company’s results suggest that this is true. In fact, in its 2020 annual report, CEO Kate W. Duchene, observed that,
“Our sustained transformation efforts since 2017, which include establishing and globalizing our Advisory Project Services group, focusing our go-to-market strategy on marquee client and industry programs, streamlining our organizational structure, and shrinking our real estate footprint while adopting a hybrid work model, have helped lay the groundwork for growth. Through the global pandemic, we gained meaningful efficiencies by pivoting how we operate and embracing a borderless talent initiative that allows us to serve clients with even greater agility.”
Just as other firms were struggling, RGP thrived, because of the efficiencies it could extract, and, I think, because firms needed their expertise that much more.
Operating Profitability Has Declined
Stripping away the impact of what researchers Rouen So and Wang call, “ancillary business activities or transitory shocks“, that are either reported on the face of the income statement or hidden elsewhere, we can calculate RGP’s NOPAT, which is GAAP net income plus the hidden and reported non-operating expenses, derived data such as implied interest on operating and variable leases, and after-tax non-operating expenses, as shown in the table below, which shows a deterioration in NOPAT from $33.66 million in 2020 to $23.1 million in 2024.
|
Values in millions |
2020 |
2021 |
2022 |
2023 |
2024 |
|
GAAP Net Income |
$ 28.29 |
$ 25.23 |
$ 67.17 |
$ 54.36 |
$ 21.03 |
|
Total Hidden Non-Operating Expense, Net |
$ 3.92 |
$ 11.86 |
$ 0.52 |
$ (0.67) |
$ 1.66 |
|
Reported Non-Operating Expense, Net |
$ 1.42 |
$ 0.27 |
$ 0.47 |
$ 3.13 |
$ (1.05) |
|
Total Derived Data for the Net Income to NOPAT Reconciliation |
$ 0.03 |
$ (10.82) |
$ 11.17 |
$ 9.80 |
$ 1.50 |
|
Change in Total Reserves |
$ – |
$ – |
$ – |
$ – |
$ – |
|
Goodwill Amortisation Expense, Net |
$ – |
$ – |
$ – |
$ – |
$ – |
|
Employee Stock Options (ESO) Expense |
$ – |
$ – |
$ – |
$ – |
$ – |
|
Interest for PV of Capitalised Operating, and Variable Leases |
$ 1.64 |
$ 1.66 |
$ 0.93 |
$ 0.93 |
$ 0.71 |
|
Classification Disclosure Adjustment |
$ – |
$ – |
$ – |
$ – |
$ – |
|
Non-Operating Tax Adjustment |
$ (1.61) |
$ (12.48) |
$ 10.23 |
$ 8.87 |
$ 0.79 |
|
Reported After-Tax Non-Operating Expense/(Income), Net |
$ – |
$ – |
$ – |
$ – |
$ – |
|
Reported Minority Interest Expense, Net |
$ – |
$ – |
$ – |
$ – |
$ – |
|
Reported Loss/(Gain) from Discontinued Operations After-Tax, Net |
$ – |
$ – |
$ – |
$ – |
$ – |
|
Reported Preferred Dividends, Net |
$ – |
$ – |
$ – |
$ – |
$ – |
|
Reported Dividends on Redeemable Preferred Stock, Net |
$ – |
$ – |
$ – |
$ – |
$ – |
|
Reported Other After-Tax Charges, Net |
$ – |
$ – |
$ – |
$ – |
$ – |
|
Net Operating Profit After Tax (NOPAT) |
$ 33.66 |
$ 26.54 |
$ 79.33 |
$ 66.62 |
$ 23.14 |
Source: Company filings and author calculations
That decline is also reflected in its ROIC (NOPAT/average invested capital), which has fallen from 8.28% in 2020 to 6.03% in 2024. In that time, its weighted average cost of capital (WACC) has remained stable. I calculate WACC using 10-year Treasuries as the risk-free rate, a market premium of 6%, and with CAPM being used for the cost of equity.
Source: Company filings and author calculations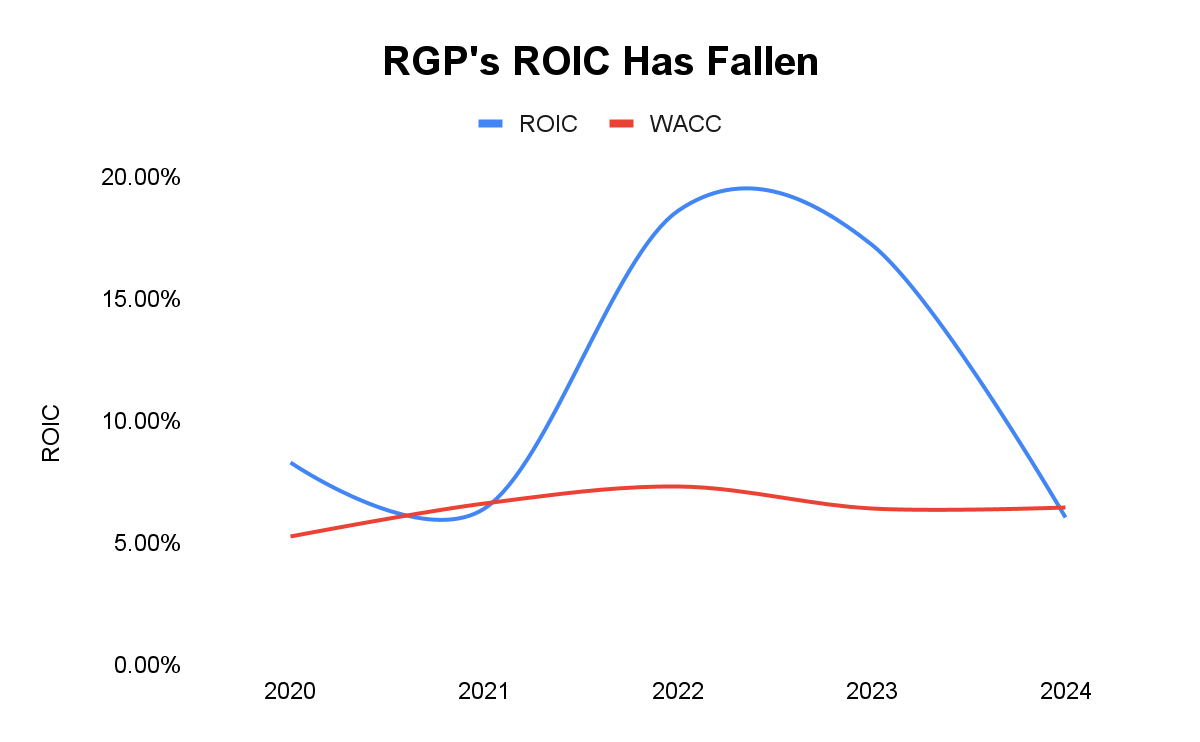
This has occurred despite the firm’s cost discipline drive, which has driven down its selling, general and administrative expenses (SG&A) over the five years period, from $228.07 million in 2020 to $208.86 million in 2024. That has not been enough to offset the sharp decline in both revenue and NOPAT. In fact, part of the decline in SG&A is because of declining revenue and profits, with the firm reporting on page 38 of its 2024 10-K, that, “The $20.0 million decrease in SG&A year-over-year was primarily attributed to a reduction in bonuses and commissions by $17.1 million, primarily related to lower revenue and profitability achievement compared to incentive compensation targets”. Rather than being a result of firm-wide efficiencies, the decline in SG&A seems to be the natural result of variable costs responding to a decline in business. Nevertheless, management has very successfully reduced its invested capital, from $406.51 million in 2020 to $$383.8 million in 2024, which, if the 2020 NOPAT had remained constant throughout the period, would have meant that the firm would earn 8.78% in ROIC in 2024.
Executive Compensation is Flawed
Businesses are prone to principal-agent conflicts, in which the principal’s interests are undermined by their agents. A public firm is prone to such conflicts because the agents, management are rarely an owner of the business and the shareholders are too diverse and meet too infrequently to exercise oversight. Executive compensation can be used to tie shareholder and management interests. According to RGP’s 2023 proxy report, in fiscal 2023, 78% of the CEO’s and approximately 74% of its named executive officers (NEOs) compensation was “at risk”, meaning that it was tied to the achievement of performance and/or stock price targets. However, the long-term incentives are poorly designed. Rather than linking compensation to ROIC, or economic earnings, or a similar metric, which drives long-term corporate valuation, the firm has tied its long-term incentives to revenue and adjusted EBITDA margin:
Source: 2023 Proxy Report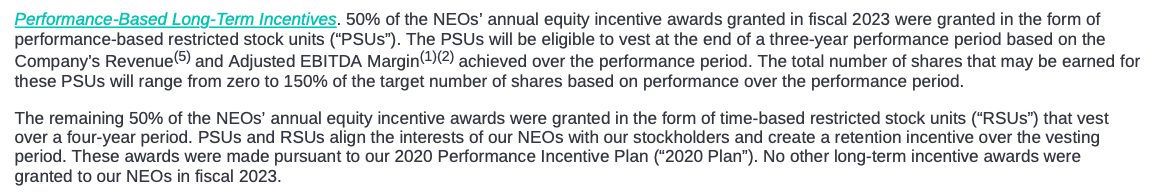
Research shows that long-term market values are driven by ROIC. New Constructs, for example, found that 63% of S&P 500 returns were explained by ROIC. Furthermore, surveys have found that 77% of investors believe that executive compensation is the best metric for linking pay to performance. In fact, New Constructs found that CEOs who focus on ROIC outperform the market.
Source: New Constructs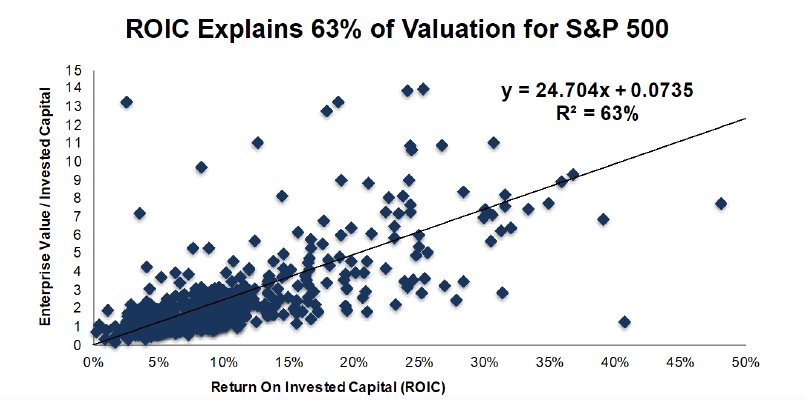
Per its 2024 10-K, RGP calculates adjusted EBITDA in the following way:
Source: RGP 2024 10-K
Conceivably, adjusted EBITDA can rise due to an increase in amortization and depreciation expense, which are a normal expense that RGP expects to have. I think this sends false signals to investors. The chart below shows just how misleading adjusted EBITDA can be:
Source: Company filings, author calculations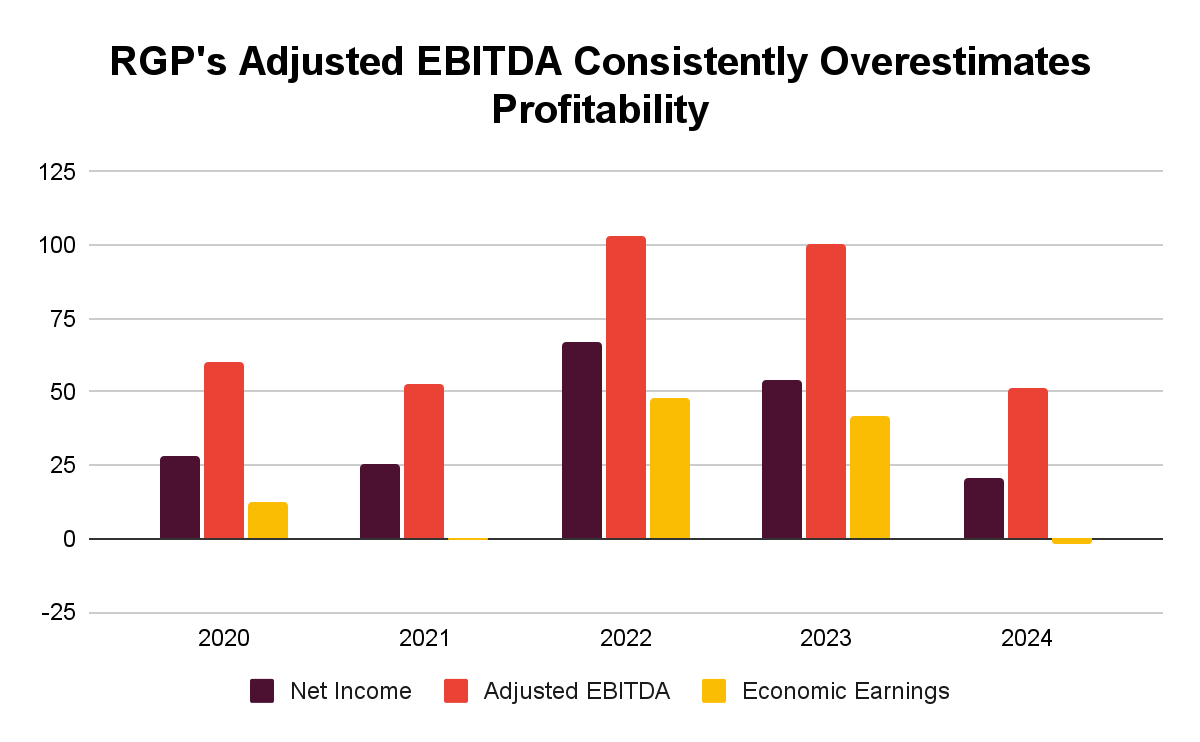
The company’s adjusted EBITDA consistently overstates the firm’s profitability, being larger than its net income and economic earnings ((ROIC-WACC)*invested capital). Explicitly tying compensation to ROIC or economic earnings would reward management for creating value, rather than risking rewarding management for increasing distorted profitability.
Dividends and Well-Supported by Free Cash Flows
RGP can be seen as a reliable source of dividends. In the last five years, RGP has generated $227.96 million in FCF (NOPAT – change in invested capital) compared to cash dividend payments of $92.02 million in FCF, although the FCF peaks are obviously very lumpy.
Source: Company filings and author calculations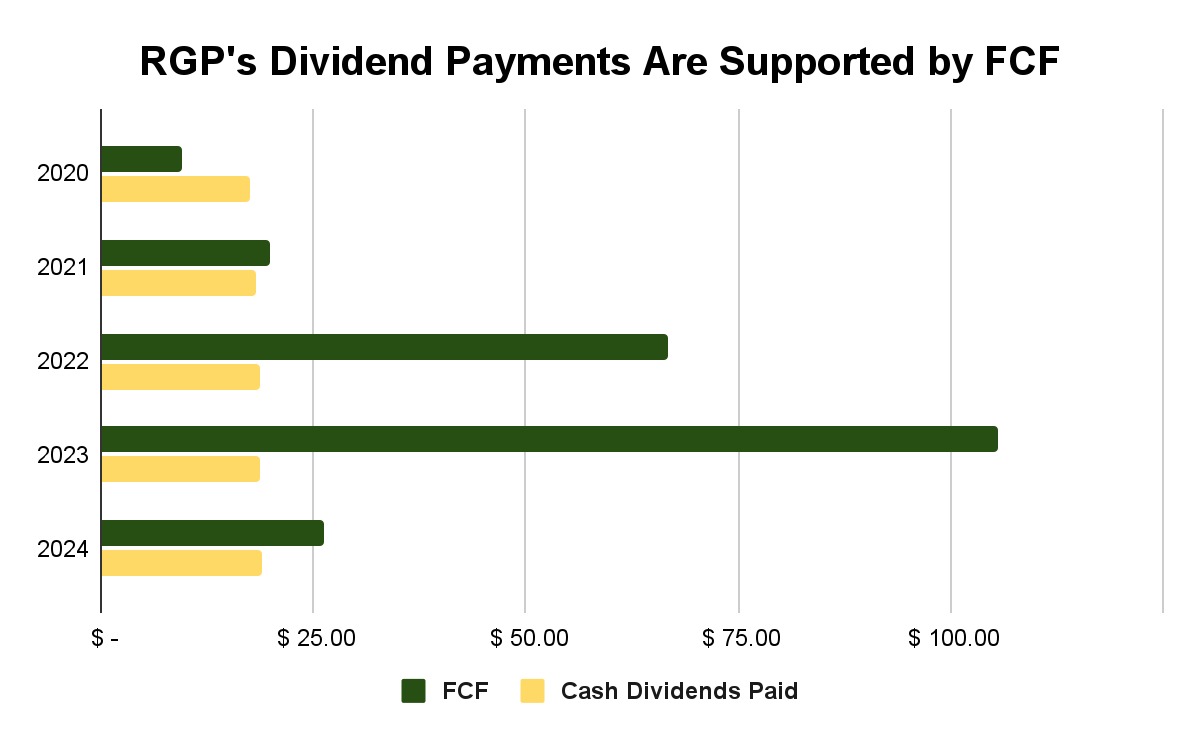
It is here that we start to see some good news: the firm’s FCF yield (FCF/enterprise value) has risen from 2.16% in 2020 to 9.18% in 2024, driven by the sharp decline in its enterprise value and improvements in FCF generation. In other words, the company’s FCF are trading at very attractive levels that indicate strong future stock market and operating performance.
Valuation
We can calculate RGP’s intrinsic value by using the convergence formula, in which, in highly competitive industries, in the long run, ROIC converges to the value of WACC, i.e. the convergence value of a firm is NOPAT/WACC. To find the intrinsic value of the whole firm using this approach, we use what New Constructs calls Economic Book Value = (NOPAT/WACC) – Adjusted total debt (including off-balance sheet debt) + Excess cash + Unconsolidated Subsidiary Assets + Net Assets from Discontinued operations – Value of Outstanding Employee stock option liabilities – Under (Over) funded Pensions – Preferred stock – Minority interests + Net deferred compensation assets + Net deferred tax assets. My calculations show that the firm has largely traded at attractive levels, that is, at price-to-EBV levels below 1.2:
|
Value in millions, except per share amounts |
2020 |
2021 |
2022 |
2023 |
2024 |
|
NOPAT |
$ 33.66 |
$ 26.54 |
$ 79.33 |
$ 66.62 |
$ 23.14 |
|
WACC |
5.25% |
6.59% |
7.29% |
6.41% |
6.43% |
|
Excess Cash |
$ 60.46 |
$ 42.92 |
$ 63.97 |
$ 78.00 |
$ 77.25 |
|
Net Assets from Discontinued Operations |
$ – |
$ – |
$ – |
$ – |
$ – |
|
Net Deferred Tax Liability |
$ – |
$ – |
$ – |
$ – |
$ – |
|
Net Deferred Compensation Assets |
$ – |
$ – |
$ – |
$ – |
$ – |
|
Fair Value of Unconsolidated Subsidiary Assets (non-op) |
$ – |
$ – |
$ – |
$ – |
$ 8.91 |
|
Fair Value of Total Debt |
$ 124.92 |
$ 80.38 |
$ 74.96 |
$ 20.81 |
$ 15.96 |
|
Fair Value of Preferred Capital |
$ – |
$ – |
$ – |
$ – |
$ – |
|
Fair Value of Minority Interests |
$ – |
$ – |
$ – |
$ – |
$ – |
|
Value of Outstanding ESO After-Tax |
$ 5.48 |
$ 2.47 |
$ 12.23 |
$ 4.75 |
$ – |
|
Pensions Net Funded Status |
$ – |
$ – |
$ – |
$ – |
$ – |
|
Economic Book Value (EBV) |
$ 571.21 |
$ 362.86 |
$ 1,064.94 |
$ 1,091.76 |
$ 430.12 |
|
Split Adjusted Shares Outstanding (thousands) |
32,144.00 |
32,885.00 |
33,197.00 |
33,475.00 |
33,556.00 |
|
EBV per Share |
$ 17.77 |
$ 11.03 |
$ 32.08 |
$ 32.61 |
$ 12.82 |
|
Stock Price (closing) |
$ 10.99 |
$ 14.58 |
$ 18.18 |
$ 15.57 |
$ 11.45 |
|
Price to Economic Book Value per Share (PEBV) |
0.62 |
1.32 |
0.57 |
0.48 |
0.89 |
Source: Company filings and author calculations
So, even though the business is challenged and can be improved, the market’s reaction to its problems has been so severe that it has left RGP undervalued.
Conclusion
RGP is a company that is clearly facing challenges. Revenue is on the decline, and with it, its NOPAT, and so, despite the firm’s aggressive cost discipline, and scaling down its invested capital, its ROIC has suffered and with it, its market price. Furthermore, the company’s executive compensation does not seem designed to align shareholder and management interests. Nevertheless, the company is a safe source of dividends, and, despite its problems, is undervalued. Furthermore, its FCF is trading at very attractive levels. Investing isn’t about buying great companies, it’s about buying undervalued ones, and for that reason, RGP is worth buying.
link


